Managing and measuring content is a simple yet not-often-discussed topic in the SEO industry.
The main culprit is obsessing over vanity metrics, which make reporting harder and doesn’t make much sense in the long term.
I propose a different approach that is grounded in reality and is closer to the business side of SEO.
N.B. This article is supposed to be an overview to inspire you. It’s not extremely practical if you don’t have previous knowledge. Most of the ideas here are basic and you can emulate them if you ask ChatGPT to write the code for you!
Why do we even measure?
The answer lies in problem solving and decision making. It’s impossible to improve something we can’t measure, even though we know it exists somewhere.
Quantifying a phenomenon is a great way of showing the potential impacts on ROI. Imagine you are asked to present a new SEO project and they ask you about estimates.
You won’t find luck if you are not able to quantify or measure the impact that content can have.
I will show you what I recommend you measure and why.
Data Sources
In plain English, which data do you need to add value?
In SEO, common sense suggests:
- Google Search Console
- Google Analytics
- Screaming Frog / any other commercial crawler
This is more than enough for many analyses but you may want to consider additional data for advanced use cases.
Content plans and even CRM or sales data allow you to ask even more and better questions if you are in complex B2B niches.
A different view on metrics
The mainstream SEO measurement process involves using the following metrics:
- Page Views/Users/Sessions
- Clicks/Impressions
- Average of some metrics like Position and CTR
- Bounce Rate
If your dashboards or reports look like this… well, you are sleeping on a lot of opportunities.
That’s because most of them are pointless and don’t add real value to a business.
In other cases, the measurement is wrong and doesn’t have any practical implication. For instance, taking the average of the position metric in Google Search Console… leads to misleading results.
In fact, the position is already an average, there is no need to repeat the process again.
Bounce Rate is extremely misleading and doesn’t lead to good actions since many pages may naturally have a high BR, e.g. articles with definitions.
The biggest mistake you can make is reporting generic metrics for an entire domain, such as the sum of total clicks, or even worse, the average bounce rate.
Using some metrics on a page level makes sense but it quickly loses ground when you consider the whole domain.
Unique Query Count
This metric is easy to obtain and is probably one of the most important ones to gauge your initial SEO efforts.
Many use Impressions as a leading indicator to understand if your content is ranking for more queries.
This other metric is a little bit more exhaustive and allows you to get an estimate of the number, without pesky duplicates.
If a page is ranking for 1000 unique queries, you may want to dig deeper and create supporting pages.
A page with a good performance but not so many queries may represent a minor chance for expansion.
Pages ranking for more queries get you more data and can give you more chances to find opportunities.
But that’s not all, you can use this metric over time to see if you are losing or gaining positions!
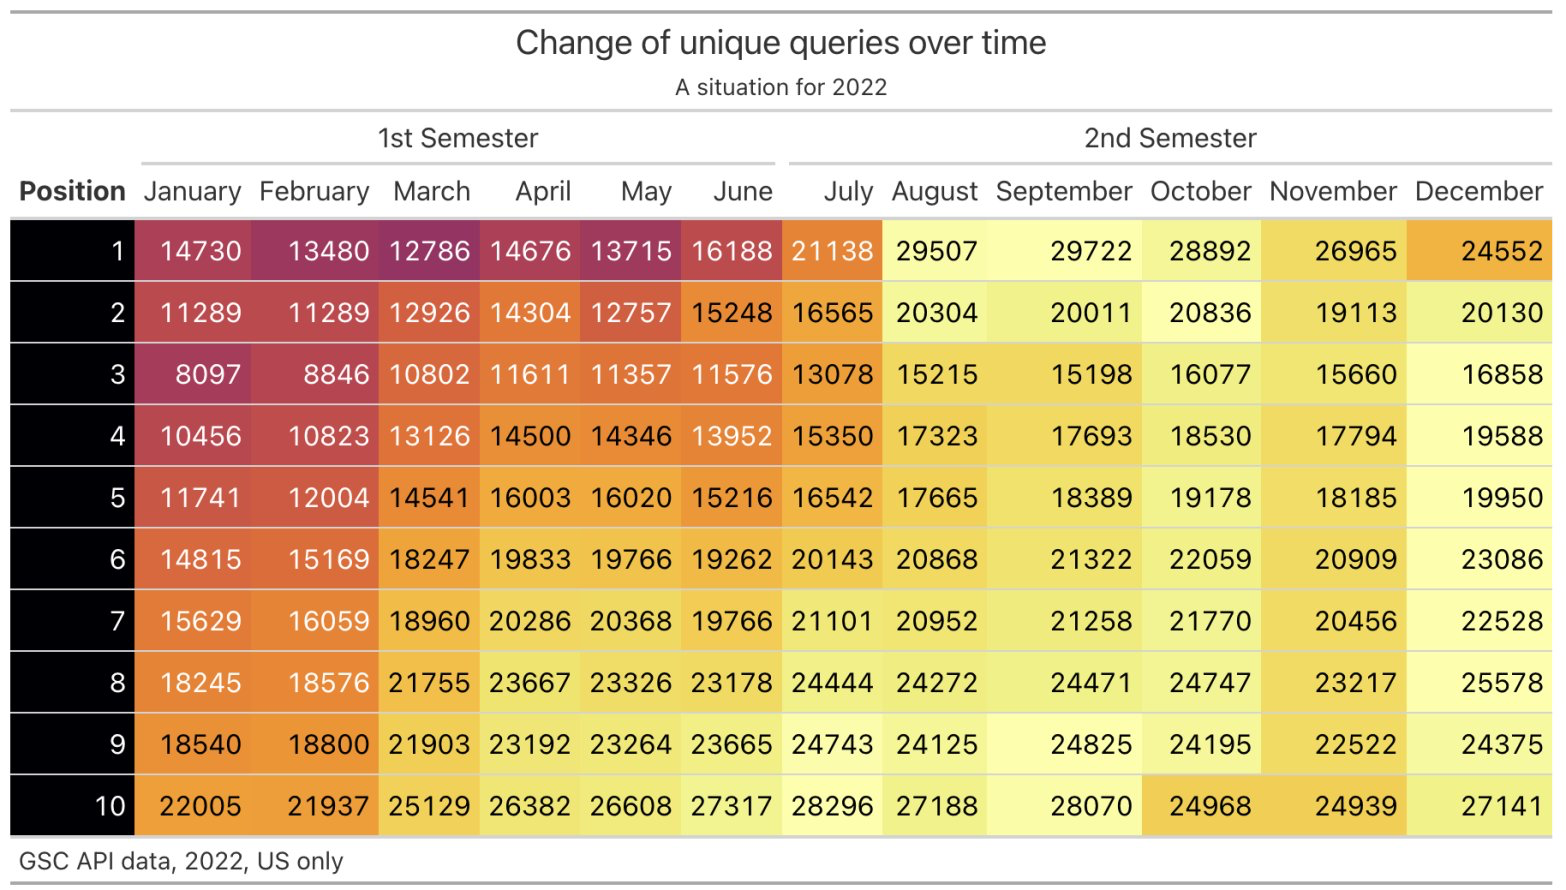
The example below shows a pivot table with a little bit of conditional formatting and editing.
Red values show combinations with fewer unique queries, whereas higher values tend to light yellow.
In the case below, you can clearly notice how the 2nd semester featured more unique queries across all the position bands.

You don’t even need to check the rows, it’s evident from the color palette.
Classify Pages
One of the most frequent problems of auditing content is translating your output into actions.
A lot of times, the problem is understanding what to do with some pages.
The proposed solution is assigning a class to each page to simplify decision making.
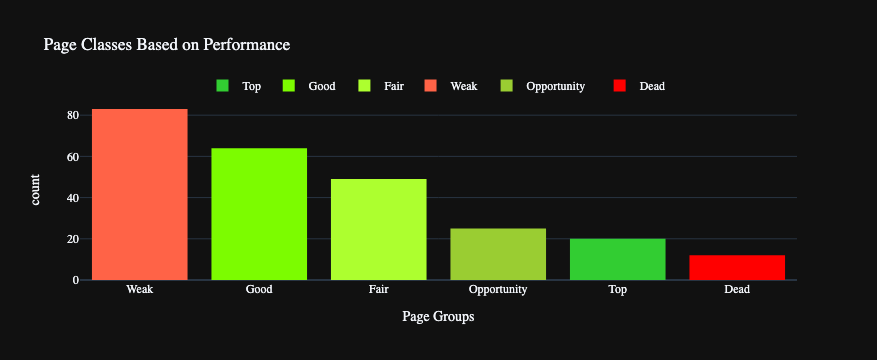
It’s necessary to define thresholds and criteria first to highlight the right issues. If your interest is measuring organic performance, clicks and impressions can be promptly used.You could create categories based on different clicks and impressions thresholds to simplify analysis.
The barplot below tells you how many pages you have per category, e.g. Weak has slightly more than 80.

For example, an article with barely any clicks would fall under a class that emphasizes a weak or non-existing organic performance.
Another good example is given by priority groups. In practice, you should prioritize content updates or creation based on what gives you the most traffic or the highest ROI.
You can once again define criteria to label a page as a priority or not. Pages showing a decline in performance or revenue are usually part of urgent changes you have to make.
This simple approach makes your life easier and sharpens your analytical skills as you get your hands dirty with data.
Time Is Important
A lot of SEO analyses put random numbers without context. This is even more nuanced if you don’t know the time when something happened.
Measuring changes over time is a good way to see what happened and when it happened. This type of reasoning can prove invaluable when dealing with seasonality.
You can refer to what we have seen when talking about the Unique Query Count because it’s the same idea.
If you are able to include time variables into your analysis, you can get some interesting insights.
It’s also possible to highlight the progress of a given topic over time (i.e. clicks or unique queries over time) to assess its individual performance.
Speaking of time, how you manage your activities is also part of the analysis. I know, it sounds strange but that’s how expert analysts think about time.
Execution speed is a crucial element of your SEO strategy, use automation and tools to your advantage!
Measuring Topical Authority
While there is no real metric to measure it, I recommend thinking in terms of clusters or groups.
Once you are able to manually label your data, you can simply create a pivot table to show which groups get more clicks.
This approach is quite rough but is a good way to start thinking in terms of groups rather than inspecting every single page.
The image below is a basic example from Google Sheets. I measure the Total Clicks, Impressions and the CTR by Topic and then check which has the highest Unique Query Count.
Based on this, I may want to dig deeper later and see which topics can be split into more subtopics based on further research.

Now, splitting pages into topics isn’t easy. And no, this is different from what we have seen with classes based on organic performance.
Google Search Console won’t do it for you so the solution is to:
- Label each page manually (Content Plans)
- Use some criteria to label pages
Depending on the context, one may win over the other. It’s not always possible to rely on Machine Learning or models to label your pages consistently but you can adopt alternative solutions.
If you have a few hundreds articles, you can label them manually on a spreadsheet and assign each to 1 or more categories.
This boring grunt work will come in handy once you do analysis and need to present aggregate results.
From Metrics To Execution
The hardest part of an auditing is what comes after: doing the job. If you keep using vanity metrics, it’s going to be impossible because you don’t have any actionable item.
That’s why I recommend you focus on the metrics I listed above, because they are more actionable than ever.
Splitting your pages into groups allows you to create matching actions, for instance:
- Pages with a weak organic performance can receive specific On-Page optimization
- Pages with a strong organic performance may consider linking more to supporting pages
- Pages that costed more to write and have a lower ROI can be ignored or monitored for a later pruning
The focus here is considering who does the job after your audit/report compared to which tool you should use.
Once you focus on what to actually do, the rest will become easier.
The Importance Of Long-Term Momentum
We have discussed analysis and insights but not really about systems or how to manage SEO content over a long span of time.
After you gauge content success, your next objective is building durable SEO systems and monitoring them.
There is no point in telling whether content is good if you can’t act on it and ensure quality continues.
I recommend exploring commercial solutions such as Airtable or Notion to keep track of your content and Zapier/ClickUp for automation.
Content plans don’t have to be complicated and I recommend you always track the following:
- Clusters
- Author
- Publishing Status (Assigned, Draft, Edited, Published, etc.)
- Comments
- Primary keyword(s)
- Possible internal links (optional)
- Platform (if you do content distribution and repurposing)
Airtable is my favorite pick because it makes creating content plans quite easy.
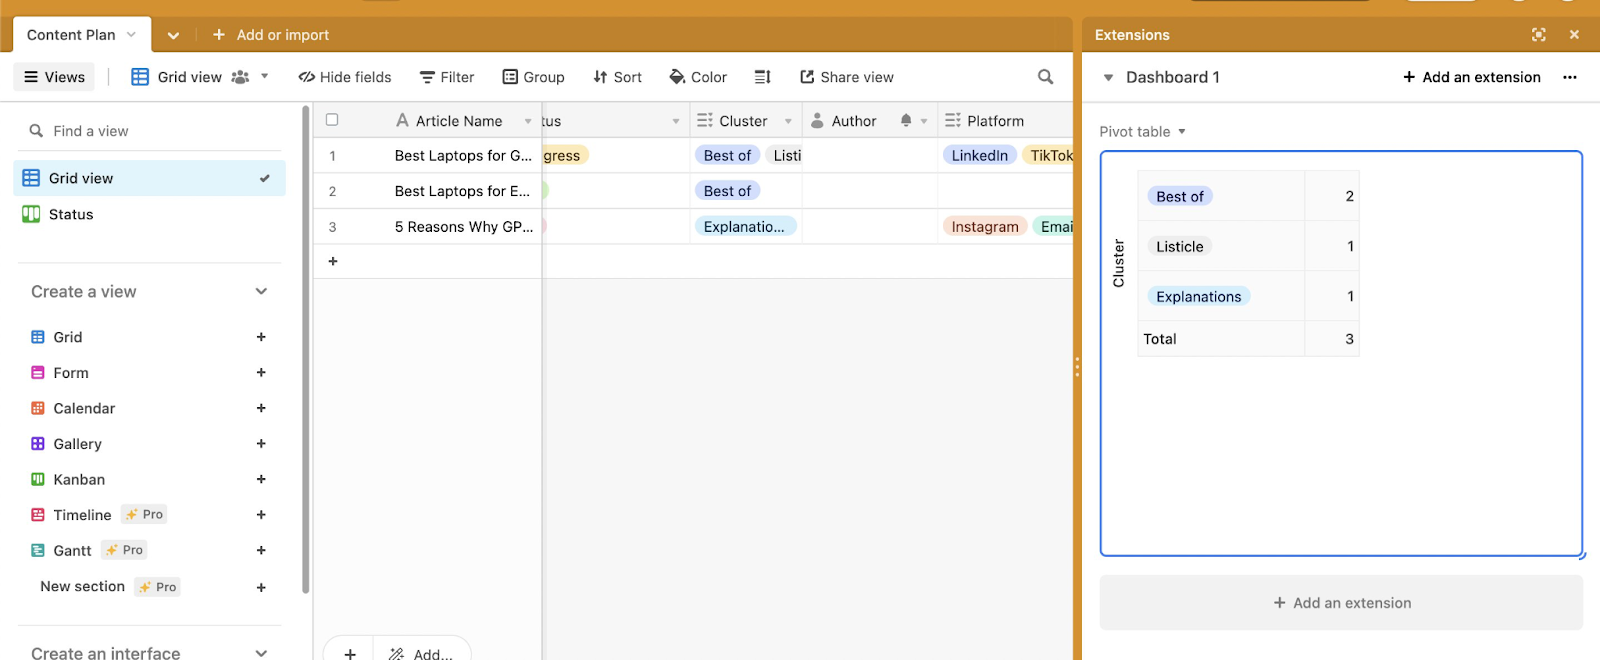
It’s also possible to build pivot tables based on the categories you have and you can also split them by publishing status, of course.
The picture below shows you the most basic example:

Once you have made some practice, you should try to add the publishing status to columns to have the ultimate content overview.
 Marco Giordano